Distributed Tracing in Rust, Episode 3: inter-service tracing
In the previous episode we were looking at the basics of tracing with the Tokio tracing framework and showed how to create traces inside a single service. Now let’s see how we can deal with inter-service communication.
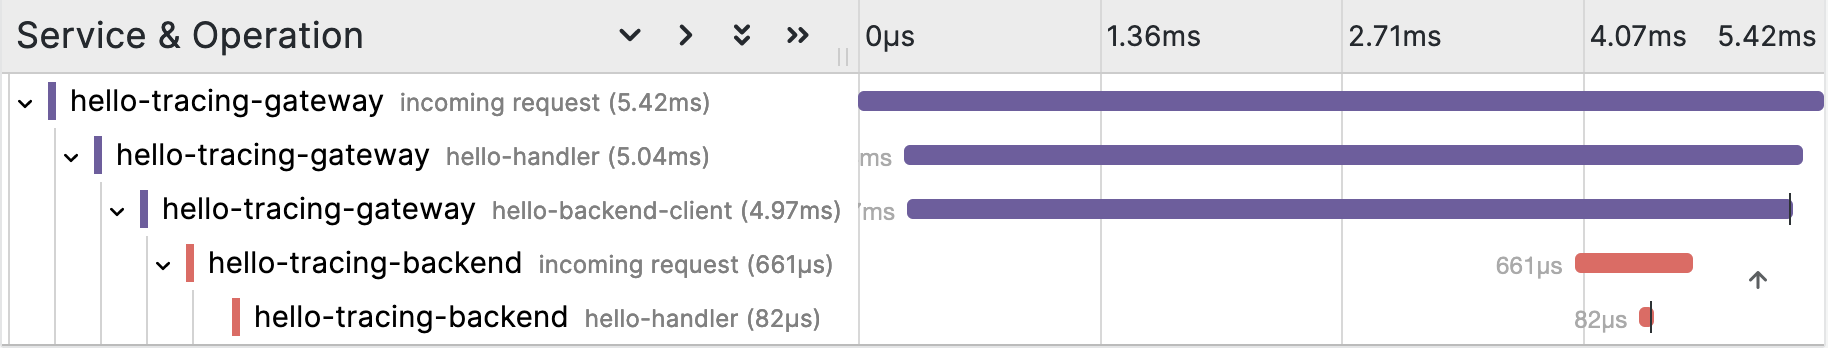
In our example we have two services: when the hello-tracing-gateway service receives a HTTP request, it calls the hello-tracing-backend service via gRPC and then responds via HTTP.
Each service uses a Subscriber emitting spans – we will look at the respective configuration later. Obviously we somehow have to propagate and connect the spans – this is known as trace context propagation – and the way we want to do it is via the OpenTelemetry standard.
Luckily there are a couple of helpful Rust crates for this purpose:
opentelemetry: the standard in Rusttracing-opentelemetry: connect spans from multiple subscribers to an OpenTelemetry traceopentelemetry-http: trace context propagation via HTTP
For trace context propagation we need two sides: the sender and the receiver of the trace context.
Receiving the Trace Context
Let’s first look at the receiver, i.e. the hello-tracing-backend service. As the communication happens via gPRC which uses HTTP/2 as transport protocol, we can make use of opentelemetry-http and its HeaderExtractor:
1 | /// Trace context propagation: associate the current span with the OTel trace of the given request, |
This function taking a Request and returning it unchanged, uses the request headers to create a HeaderExtractor which again is used in a call to get_text_map_propagator from the opentelemetry API. propagator.extract then returns an opentelemetry::Context which we use to set as the parent of the current Span from tracing. So if the headers contain valid OpenTelemetry trace context values, these are used to associate the current span with the overall OpenTelemetry trace.
We use this function in our tonic based gRPC server in hello-tracing-backend:
1 | pub async fn serve(config: Config) -> Result<()> { |
Here we use tower::ServiceBuilder to add a layer before the actual gRPC service v0::hello. That layer not only adds – like explained in the previous episode – tracing to requests via the TraceLayer, but also uses the above accept_trace function in the map_request call to propagate the trace context.
Sending the Trace Context
All right, now let’s look at the sender, i.e. the hello-tracing-gateway. This time we have to stick to the tonic API – namely an Interceptor – to send the trace context. Therefore we cannot use opentelemetry-http and its HeaderInjector, but we have to roll our own:
1 | struct MetadataInjector<'a>(&'a mut MetadataMap); |
With that Injector implementation we can define a function taking a Request and returning it unchanged and wrapped in an Ok. Again we use get_text_map_propagator from the opentelemetry API, this time to call propagator.inject_context with an OpenTelemetry trace context built from the current Span from tracing:
1 | /// Trace context propagation: send the trace context by injecting it into the metadata of the given |
This send_trace is then used as tonic interceptor, such that for outgoing service calls the trace context is propagated:
1 | let endpoint = Endpoint::from_str(&self.config.endpoint) |
Configuring the Subscriber
In the first episode we introdued the tracing_subscriber crate and used it to set up a formatter layer logging JSON formatted representations of tracing events. Let’s now extend the setup and add a layer exporting tracing data via the OpenTelemetry Protocol (OTLP) to a configurable backend which then can be used to visualize traces:
1 | /// Create an OTLP layer exporting tracing data. |
Here we are using the opentelemetry_otlp crate to create an exporter based on tonic/gRPC with configurable endpoint and service name. With this exporter we create a Tracer from the opentelemetry API which is then used to create the layer.
All that is left to do is add this OTLP layer to the tracing_subscriber:
1 | tracing_subscriber::registry() |
With this setup and a properly configured tracing backend – we use Grafana Tempo – we can visualize traces like already shown in the previous episode:
Now we are almost there. What’s left to do is correlate logs and traces, but we’ll leave that to the next episode. As usual, the already fully fleshed out example code can be found at hello-tracing-rs on GitHub.